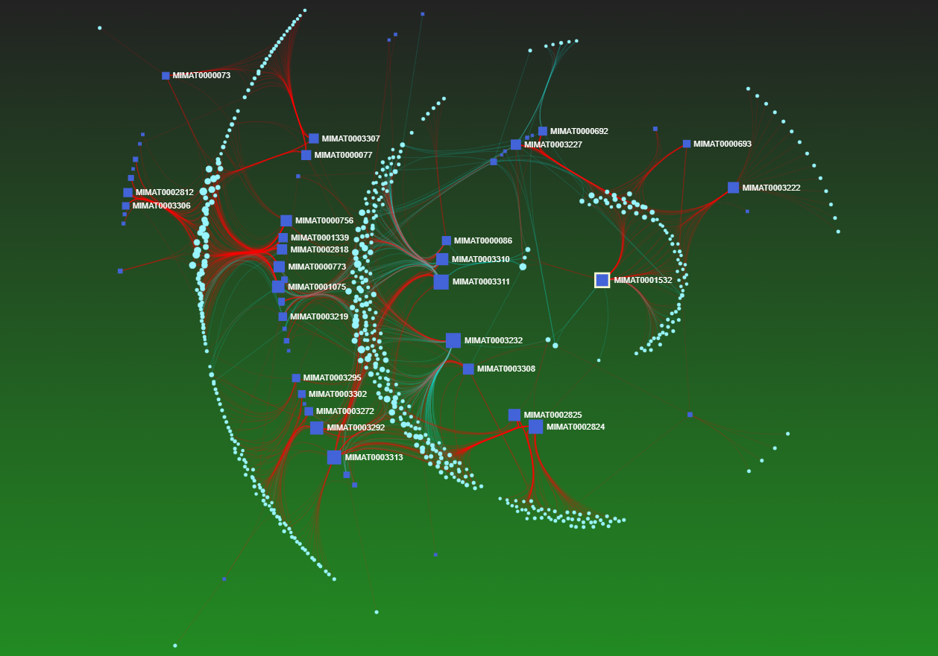
Concentric circle layout displaying MIMAT0001532 as focal node
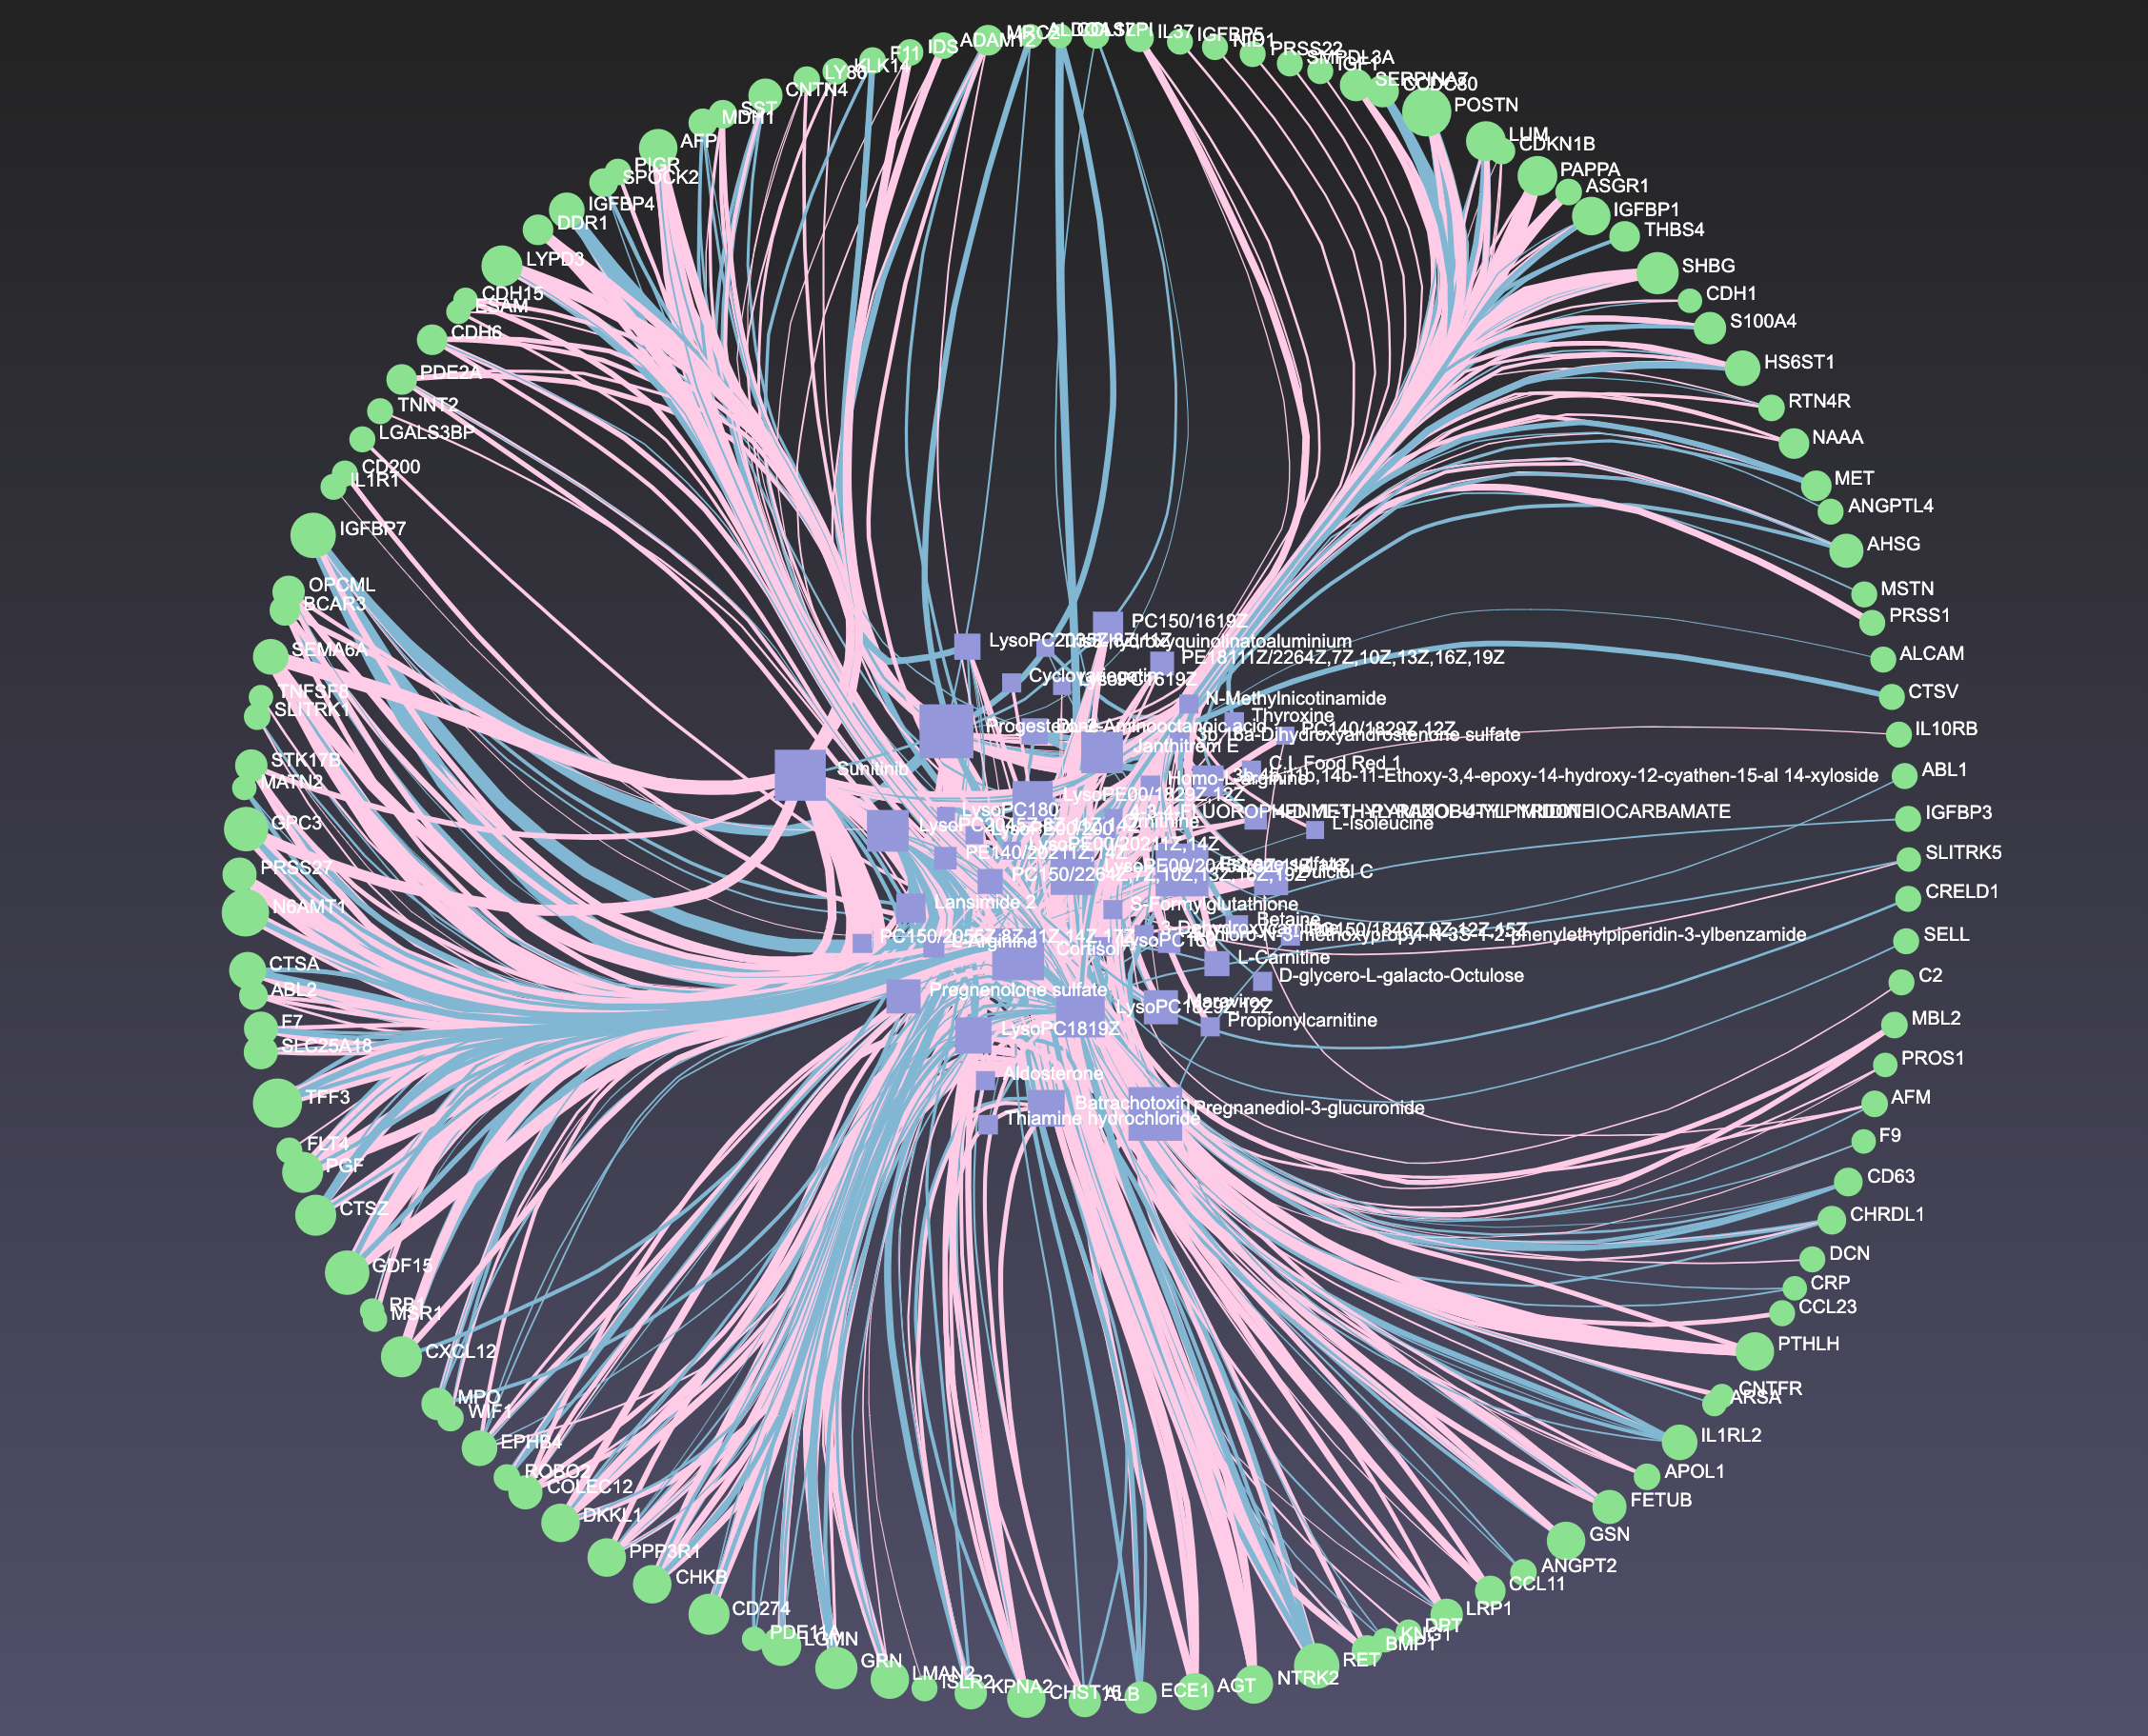
Circular bipartite network
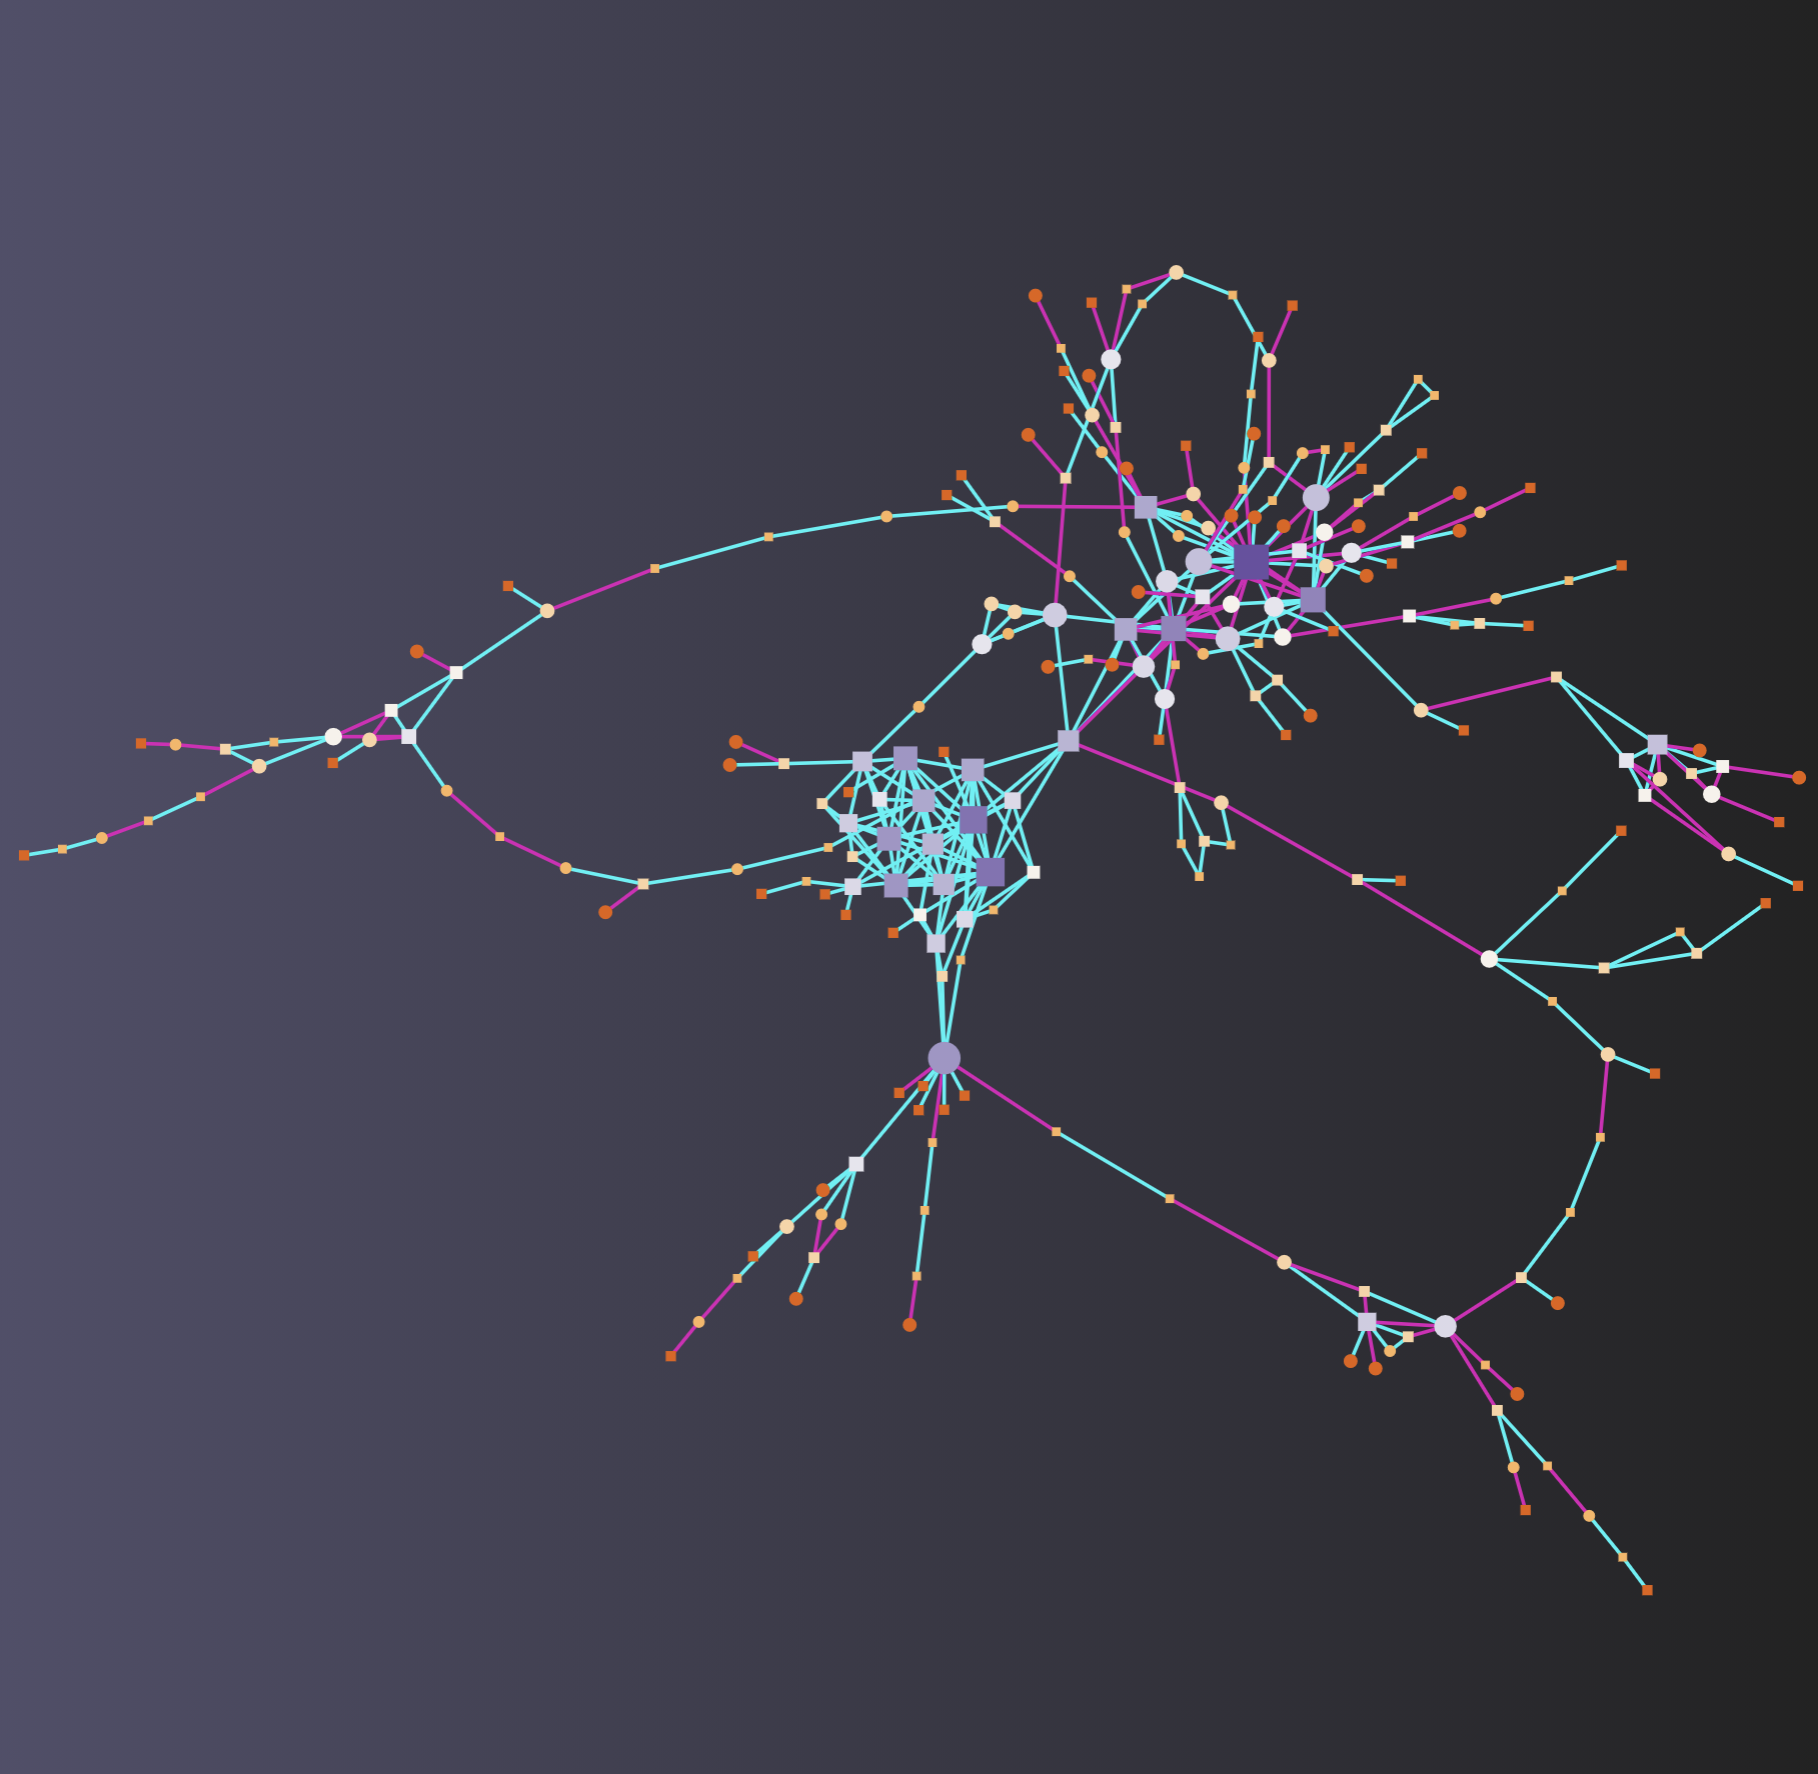
Backbone layout to reveal innate graph structure
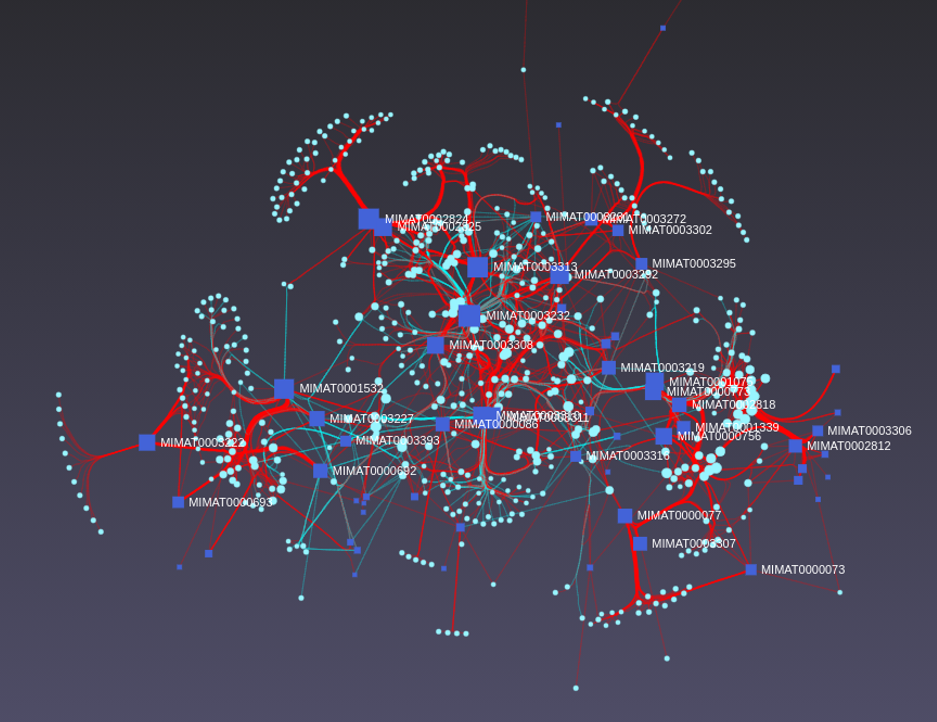
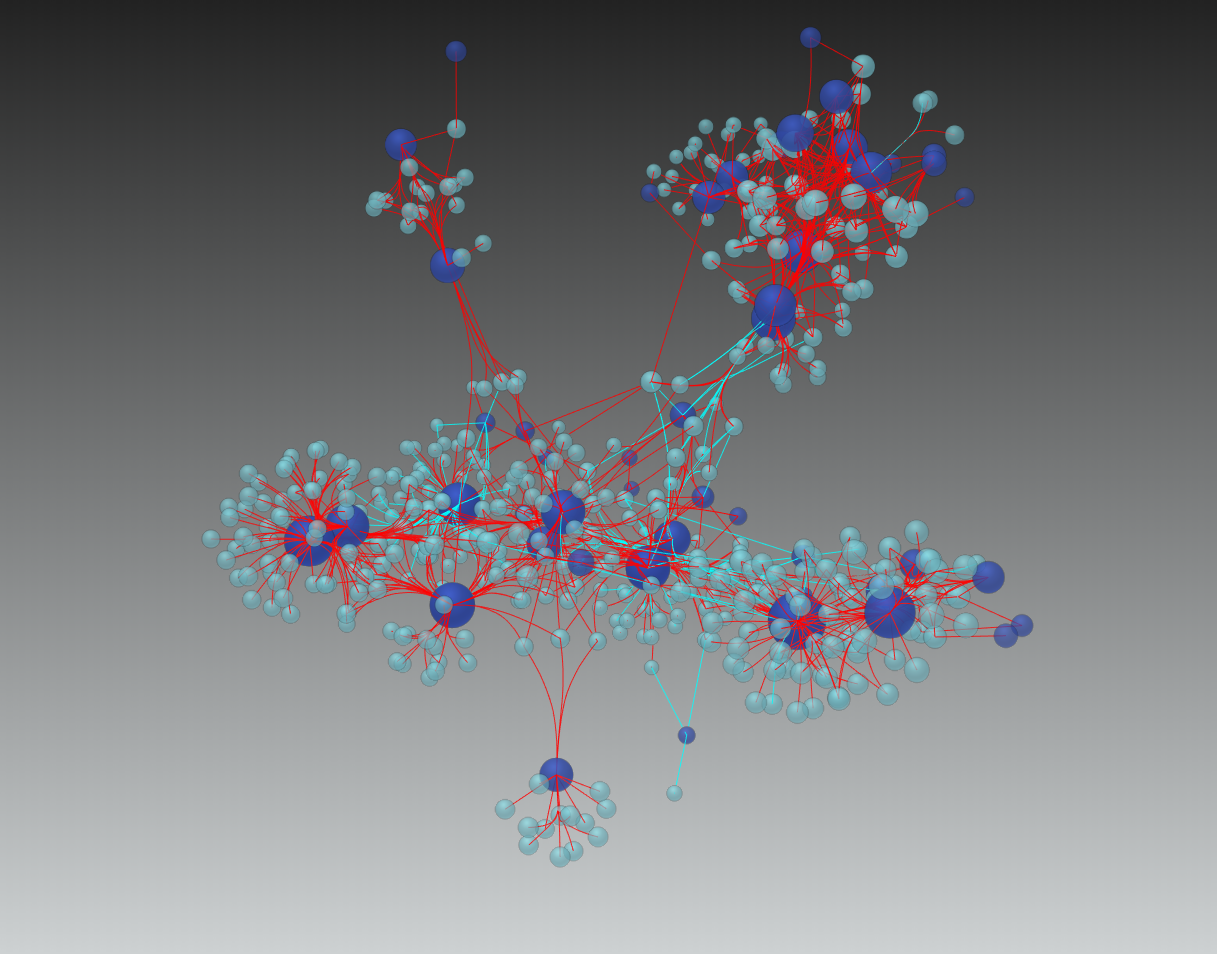
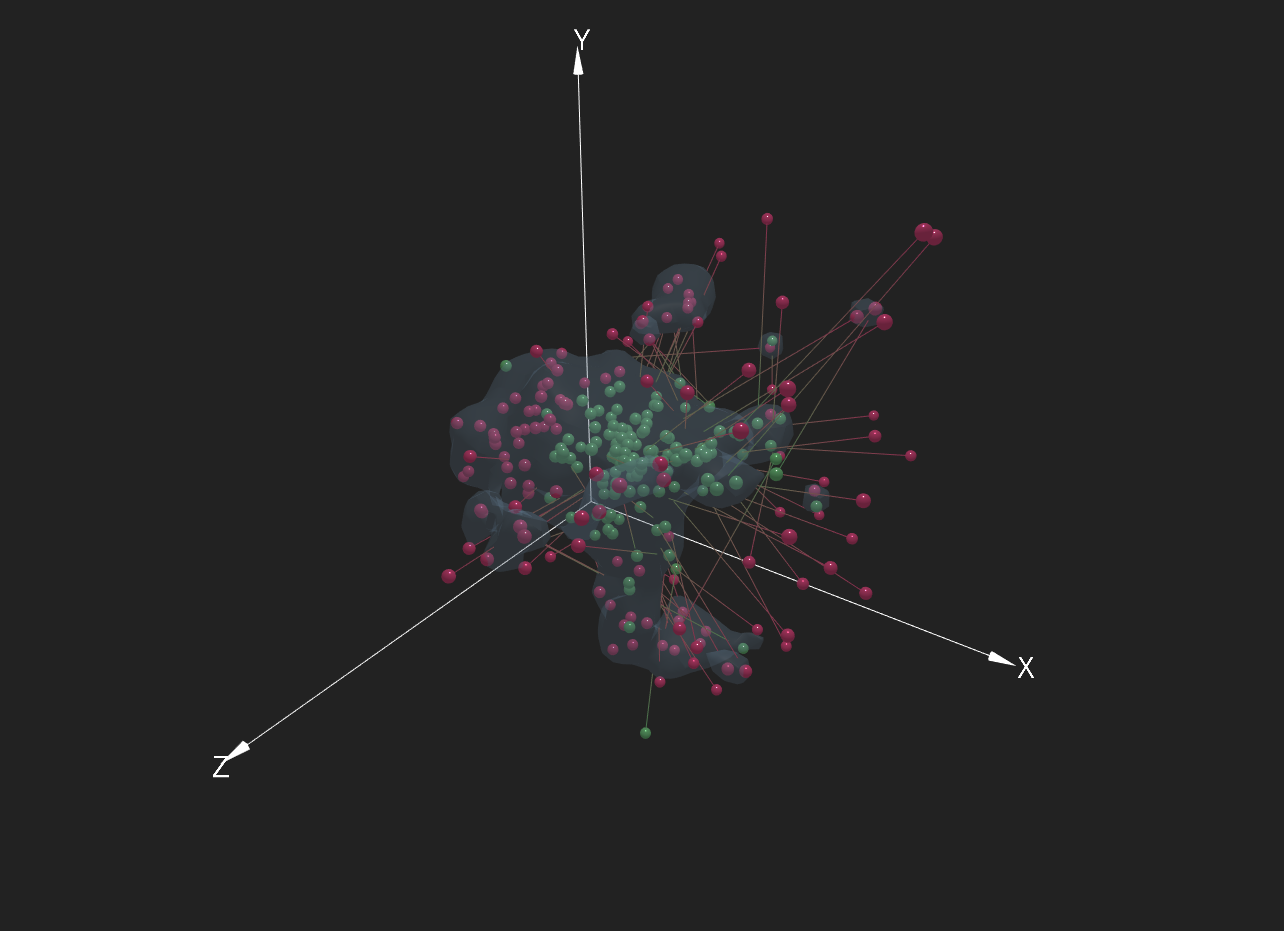
3D force directed layout with edge bundling
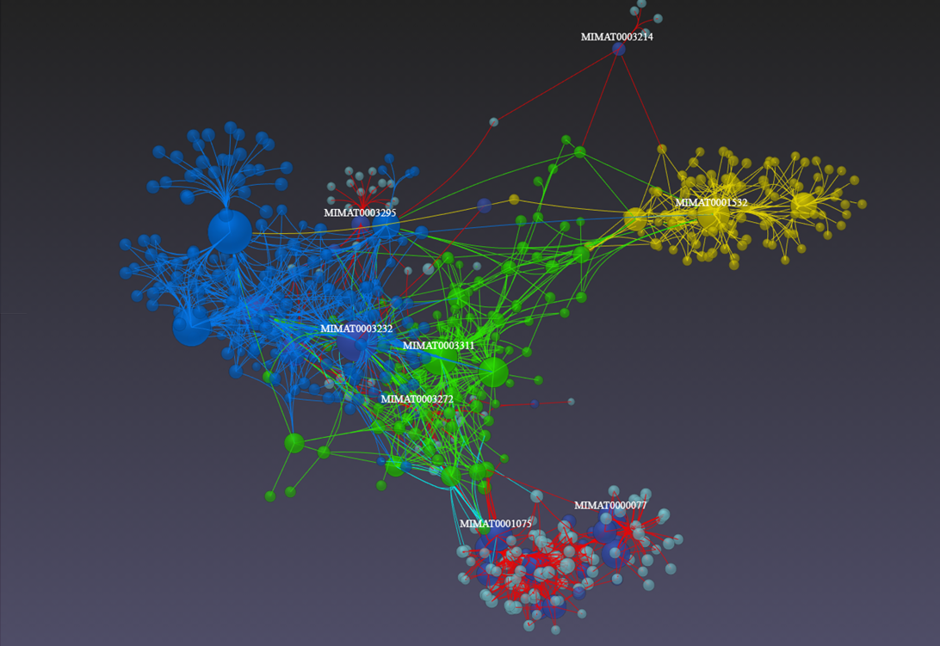
3D force directed layout with graph communities highlighted
Force directed layout with partial correlation edges
Adding walls and floor to customize the visualization environment
Superimposing two different omics using MCIA algorithm
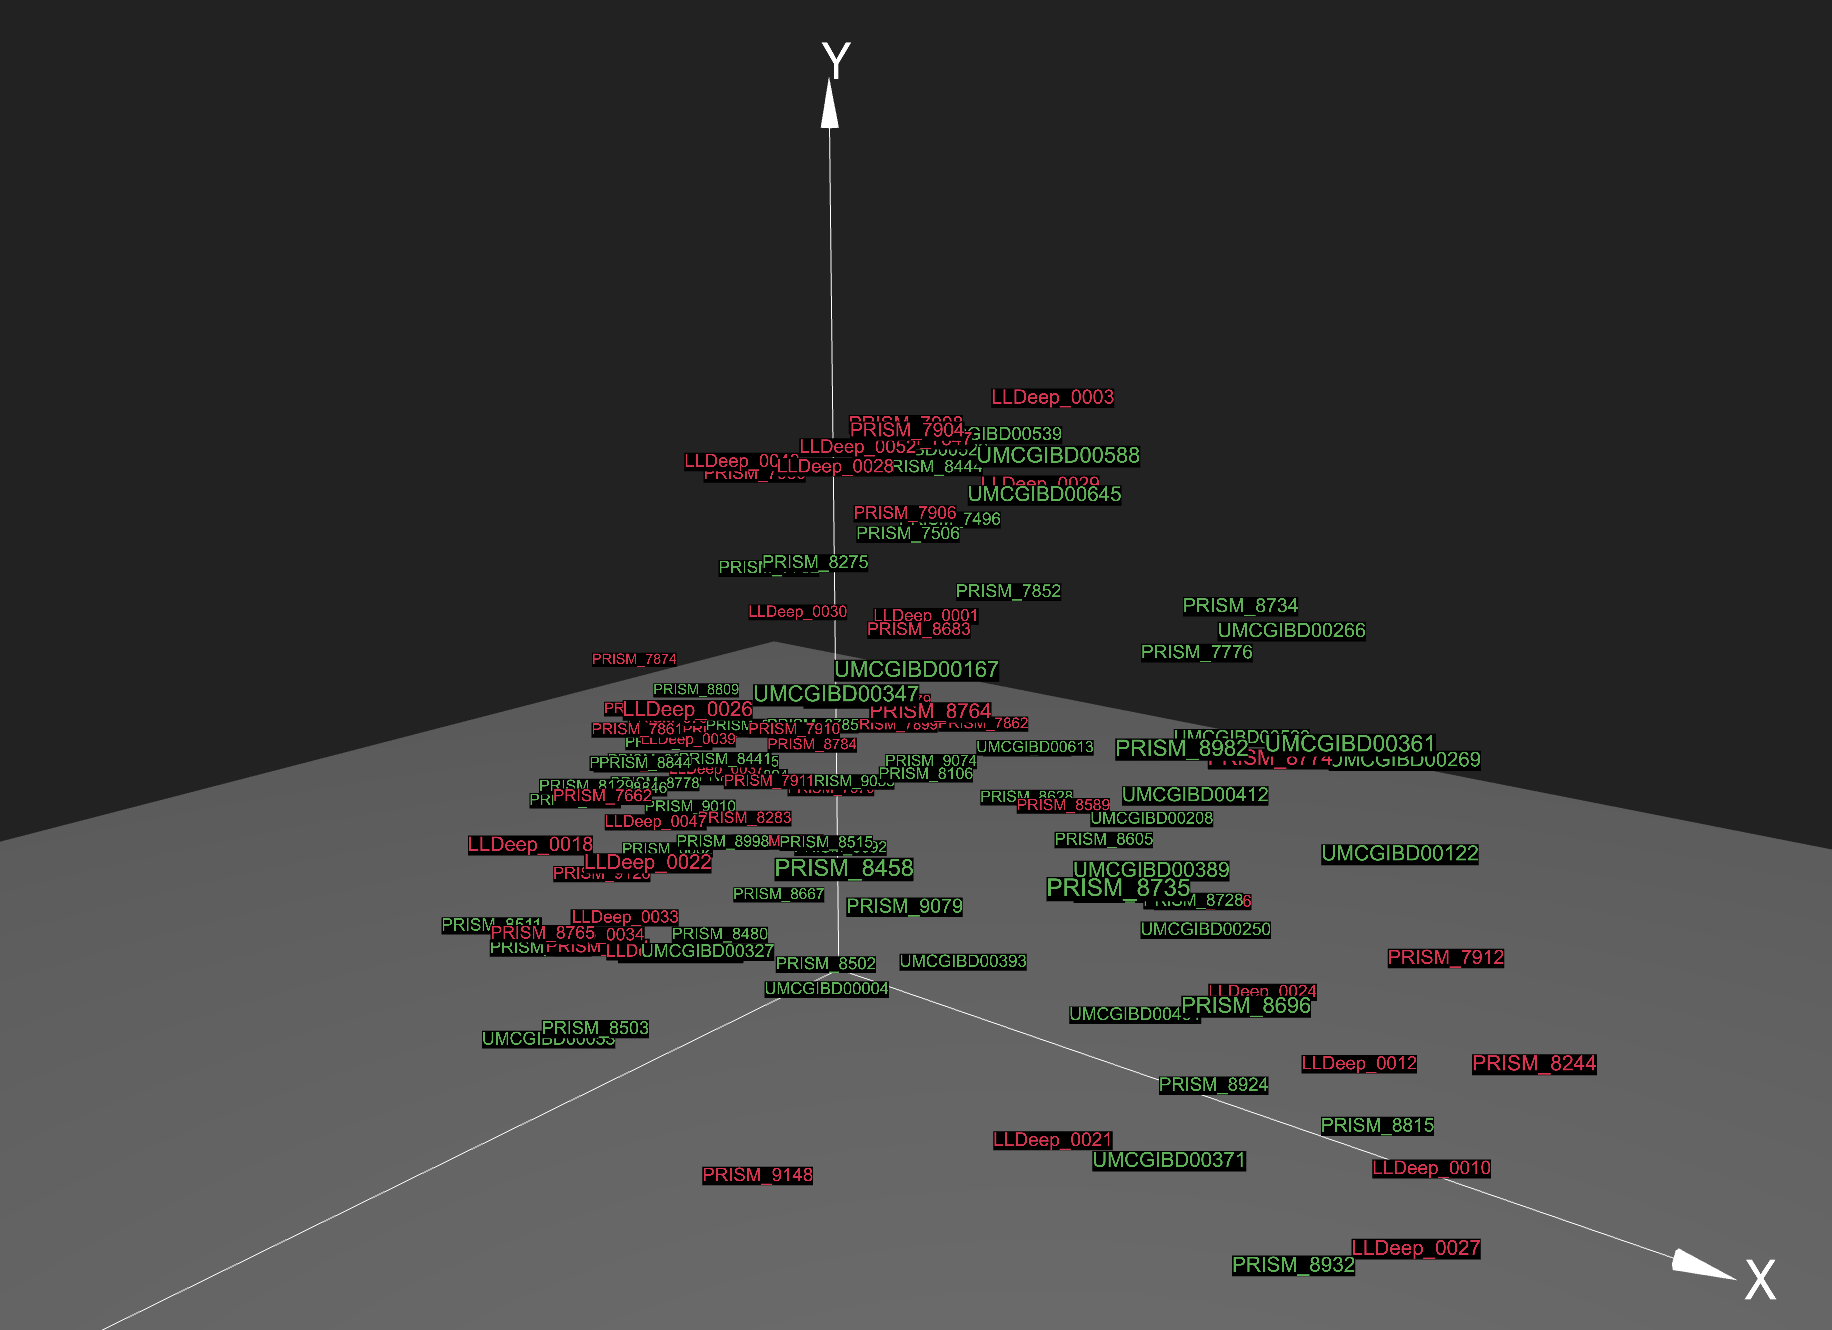
Showing sample names instead of colored nodes
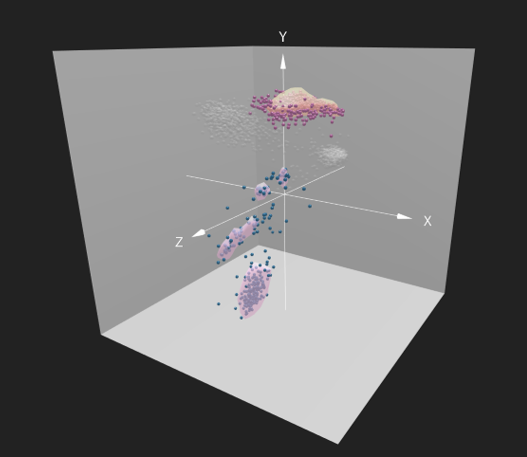
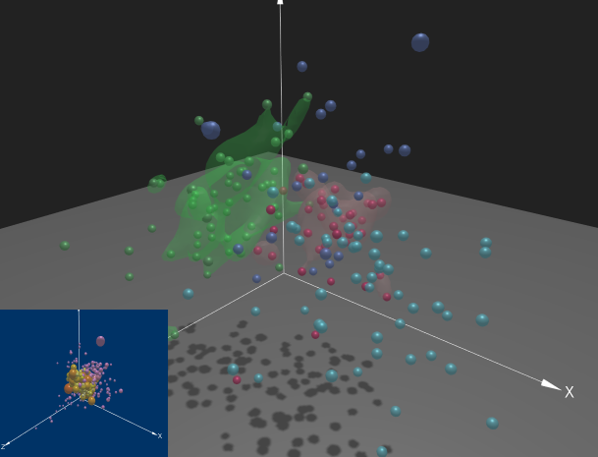
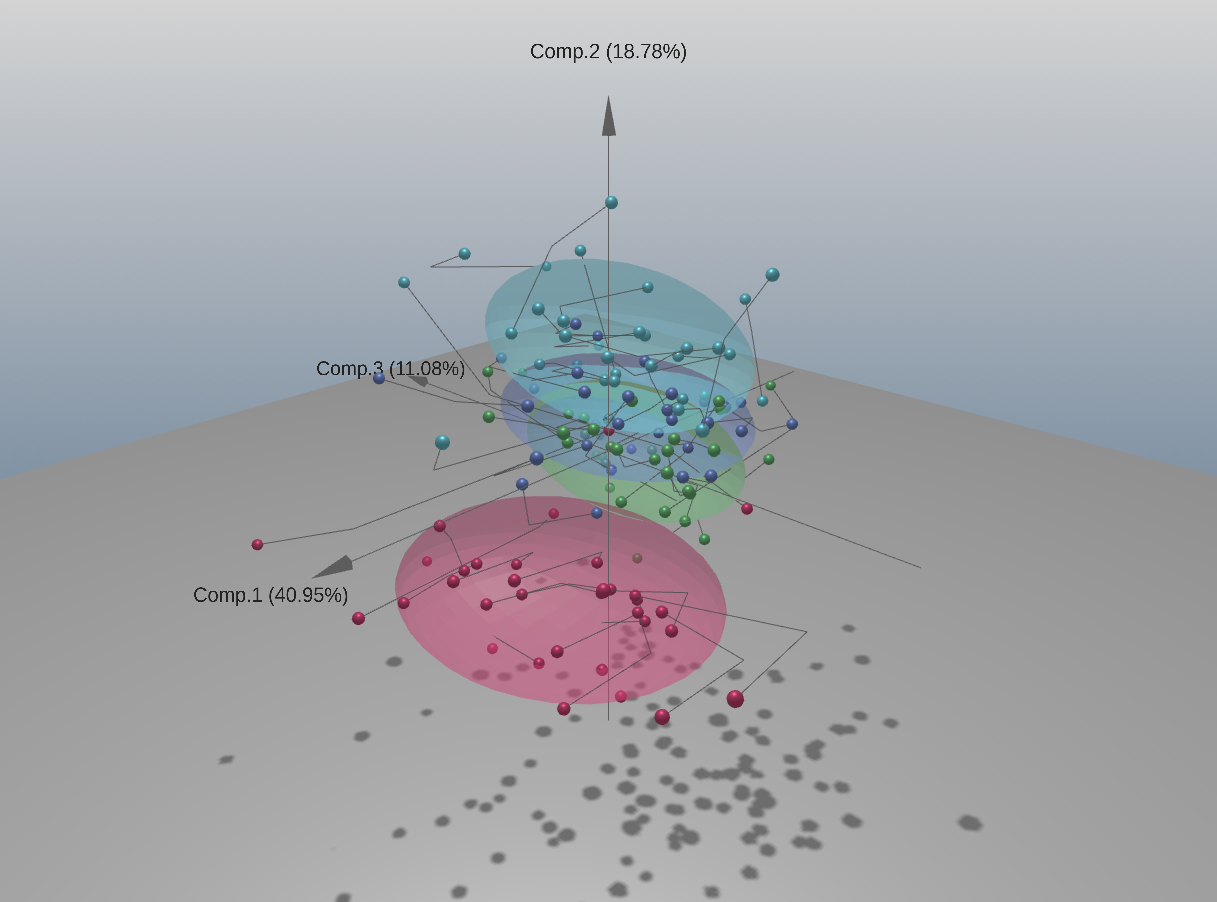
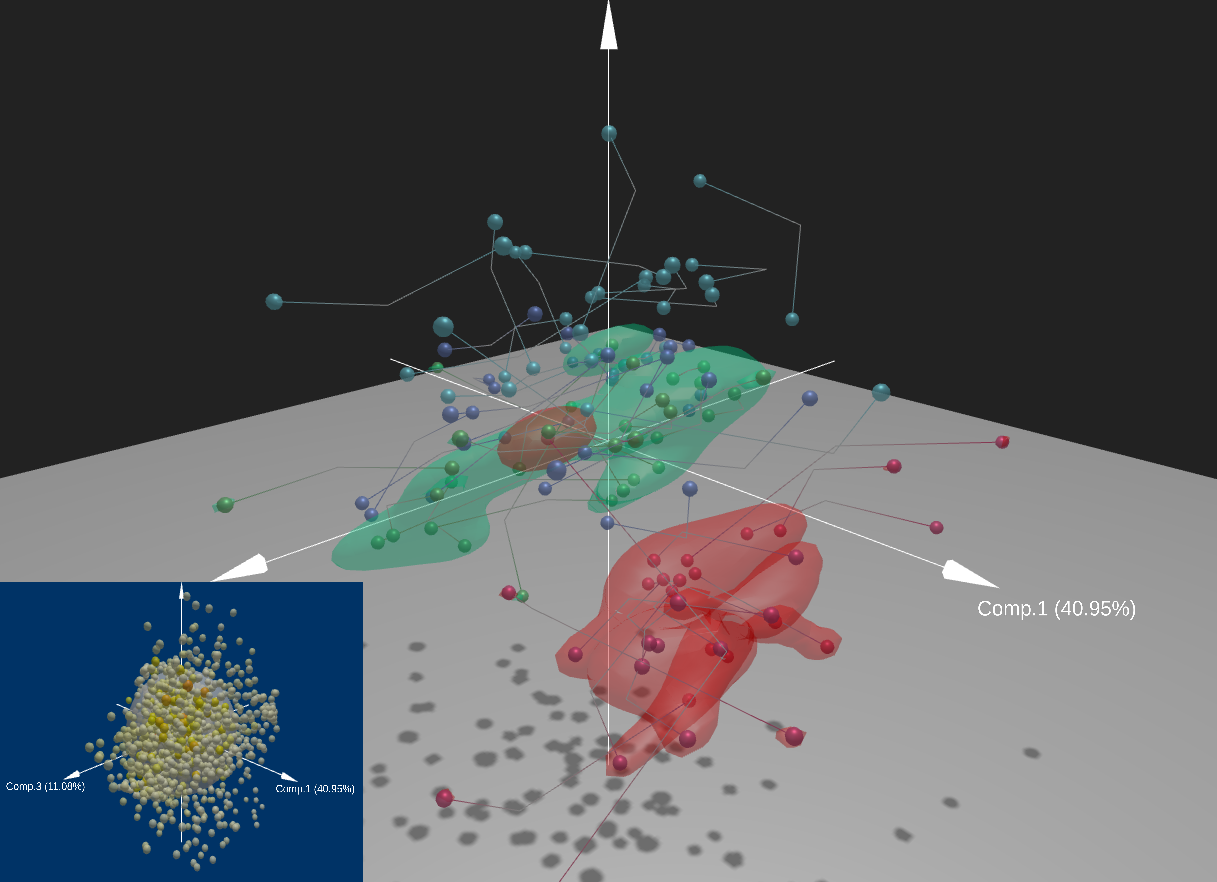
Kernel density contour on results from Procrustes analysis
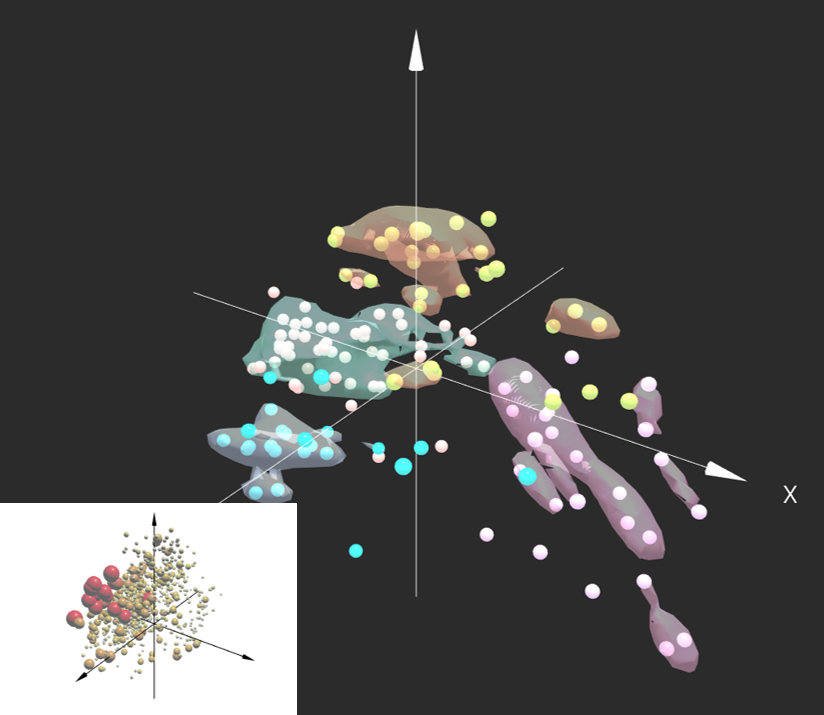
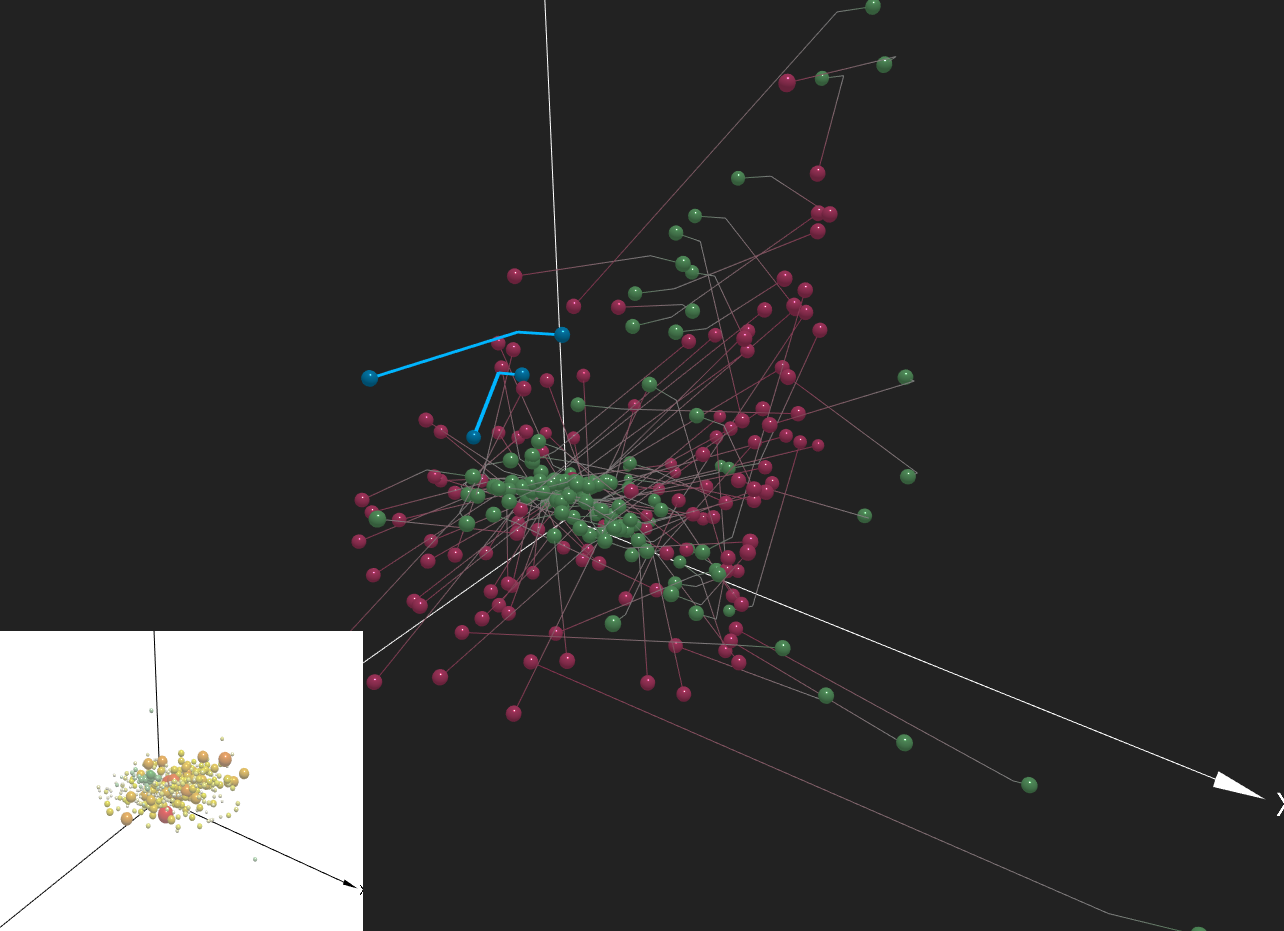
Synchronized visualization of scores (main) and loadings (inset)
Kernel density contour on results from mbPCA
Loading biplot (overlaying sample confidence ellipsoid on loading plot) on results from PLS, using Human Pregnancy example dataset
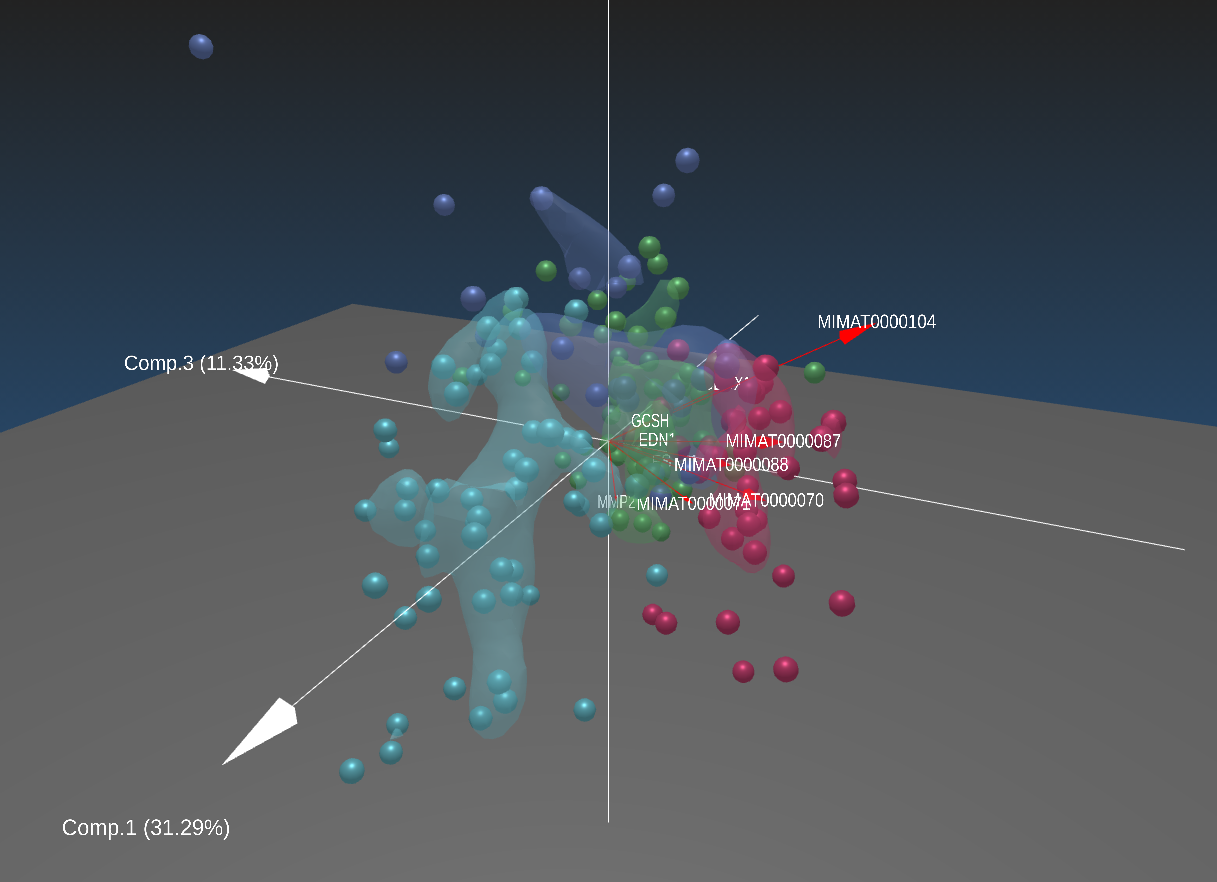
Sample biplot (overlaying top 5 most contributing features on sample plot) on results from CPCA, using TCGA example dataset
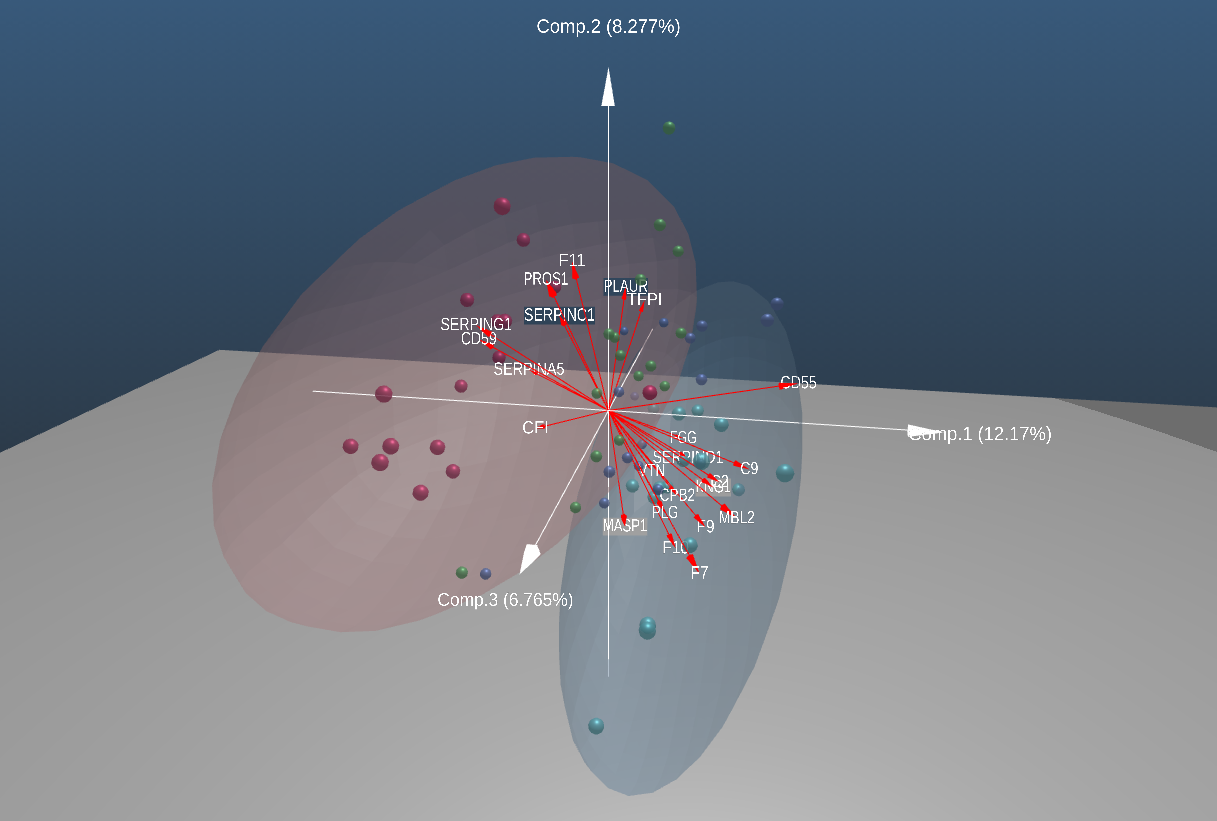
Sample biplot from Human Pregnancy example dataset with arrows representing significant genes that are involved in NOD-like receptor signaling.
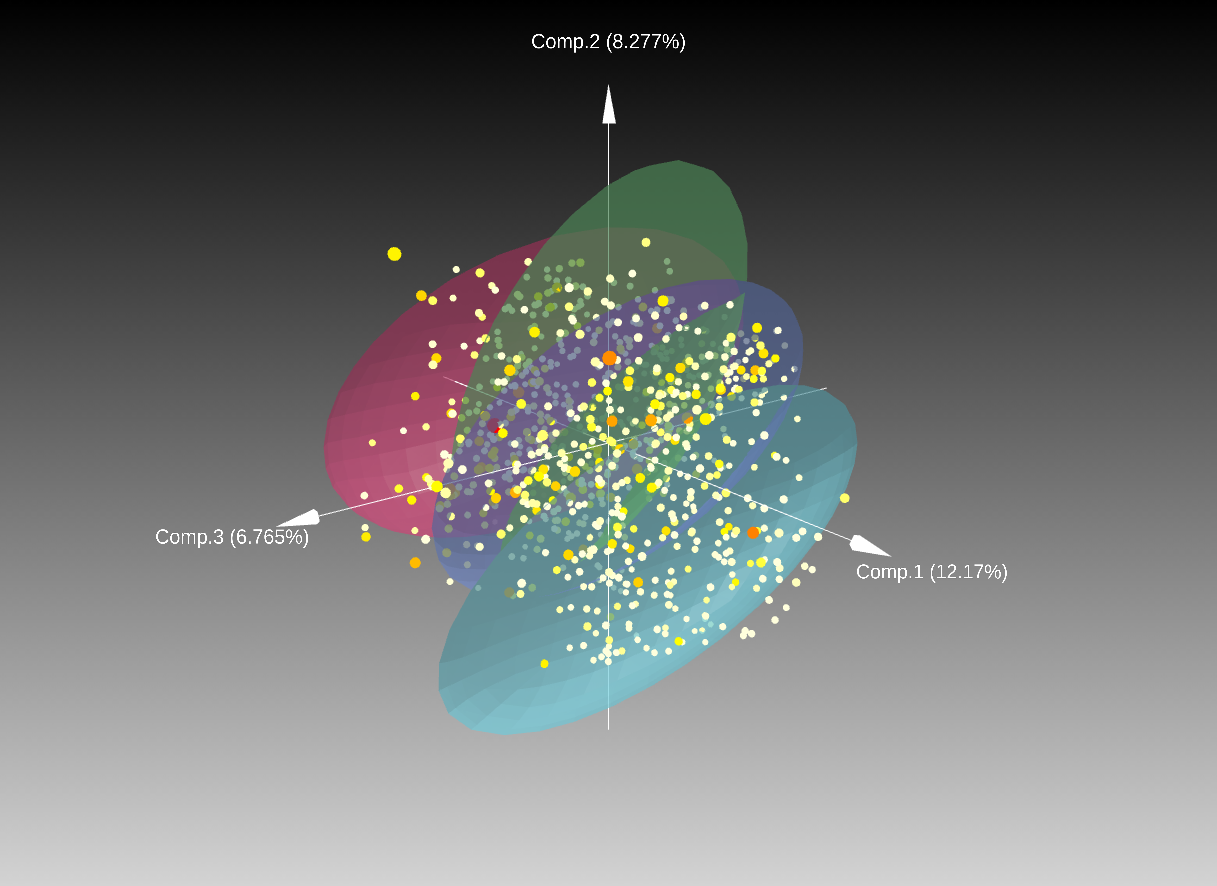
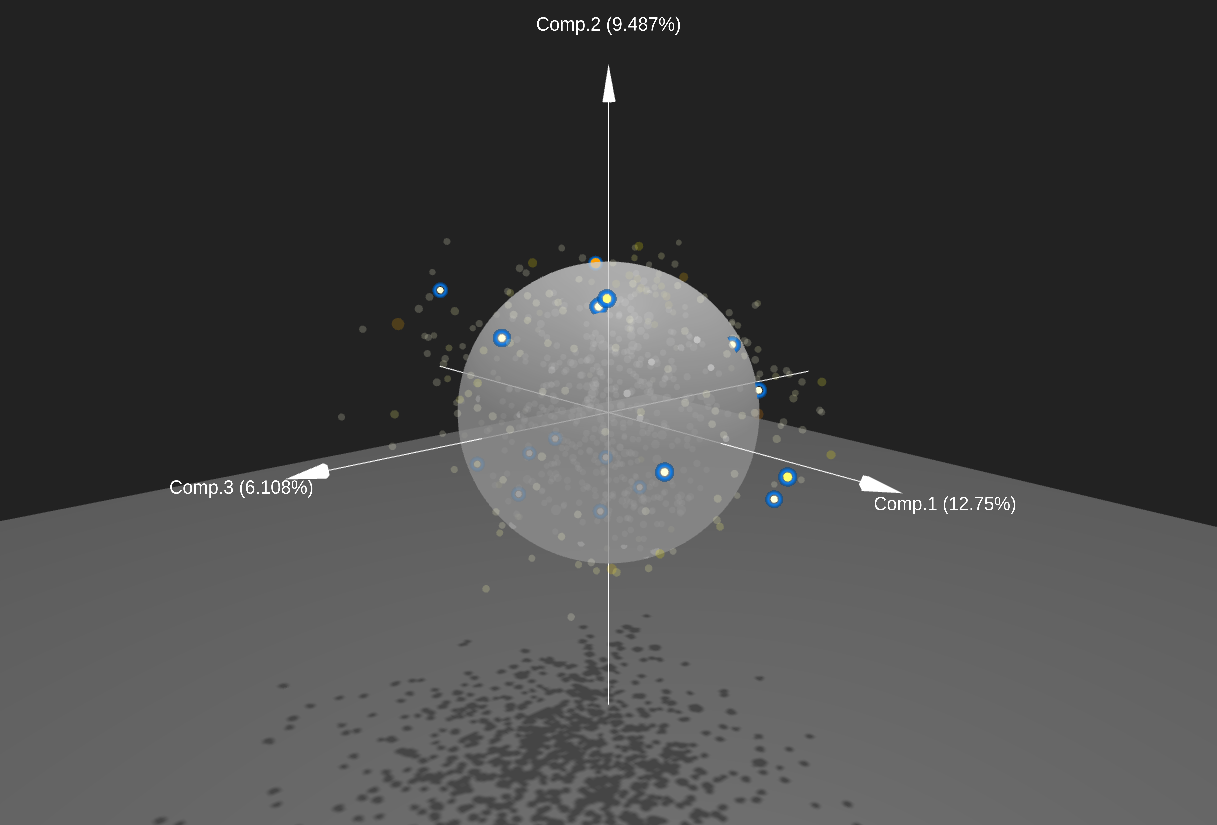
Confidence ellipsoid (95%) on results from MCIA, using Human Pregnancy example dataset
Kernel density contour and corresponding loading plot on results from MCIA, using Human Pregnancy example dataset
Loading biplot (overlaying confidence ellipsoids corresponding to meta group on top of loading plot) from Human Pregnancy example dataset with genes involved in NOD-like receptor signaling highlighted.
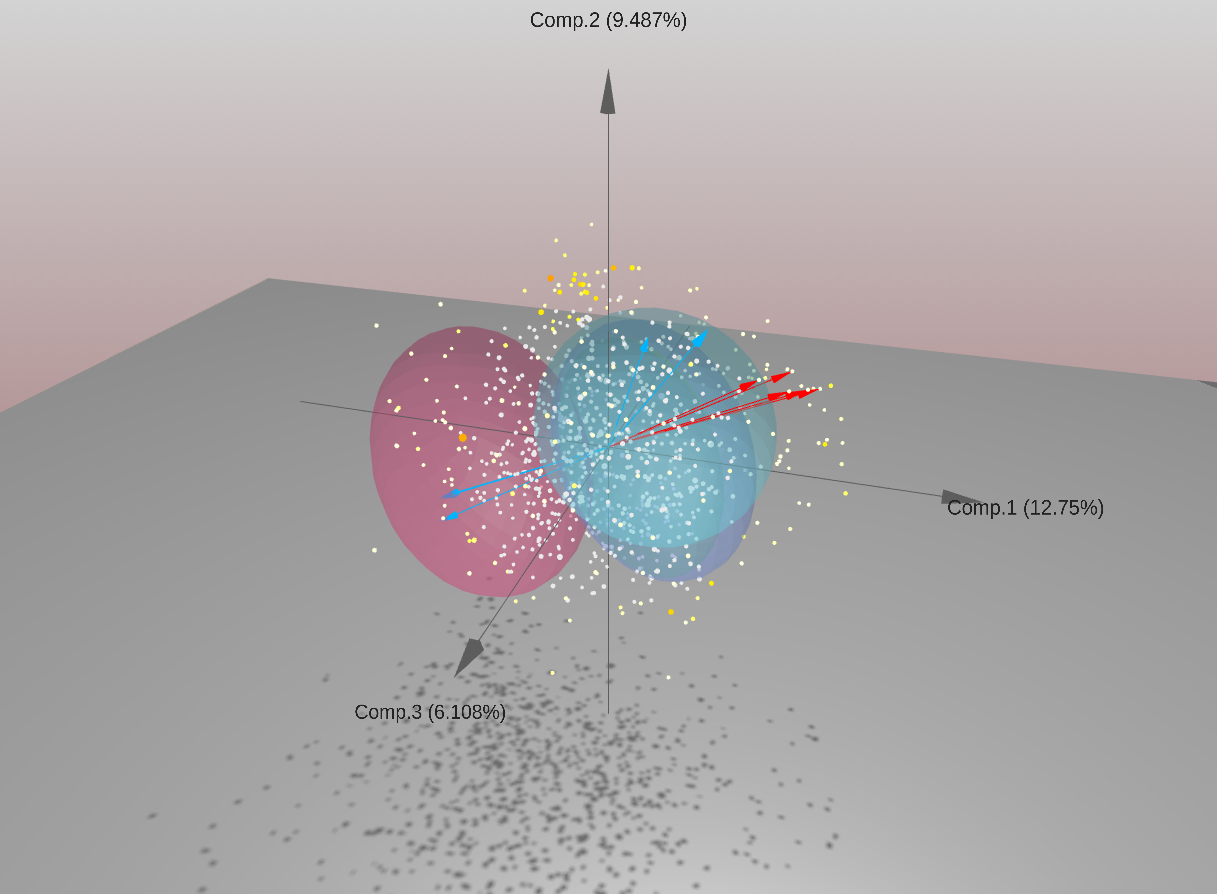
Loading biplot from Human Pregnancy example dataset with arrows representing top 5 contributing metabolites and proteins.
